Task description
Create a reporting tool for marketers to keep track of their campaigns.
The user has metrics to check:
- ad clicks;
- app installs;
- conversion rate;
- spend;
- average install cost;
- events happening after install.
The user has metrics to check:
- ad clicks;
- app installs;
- conversion rate;
- spend;
- average install cost;
- events happening after install.
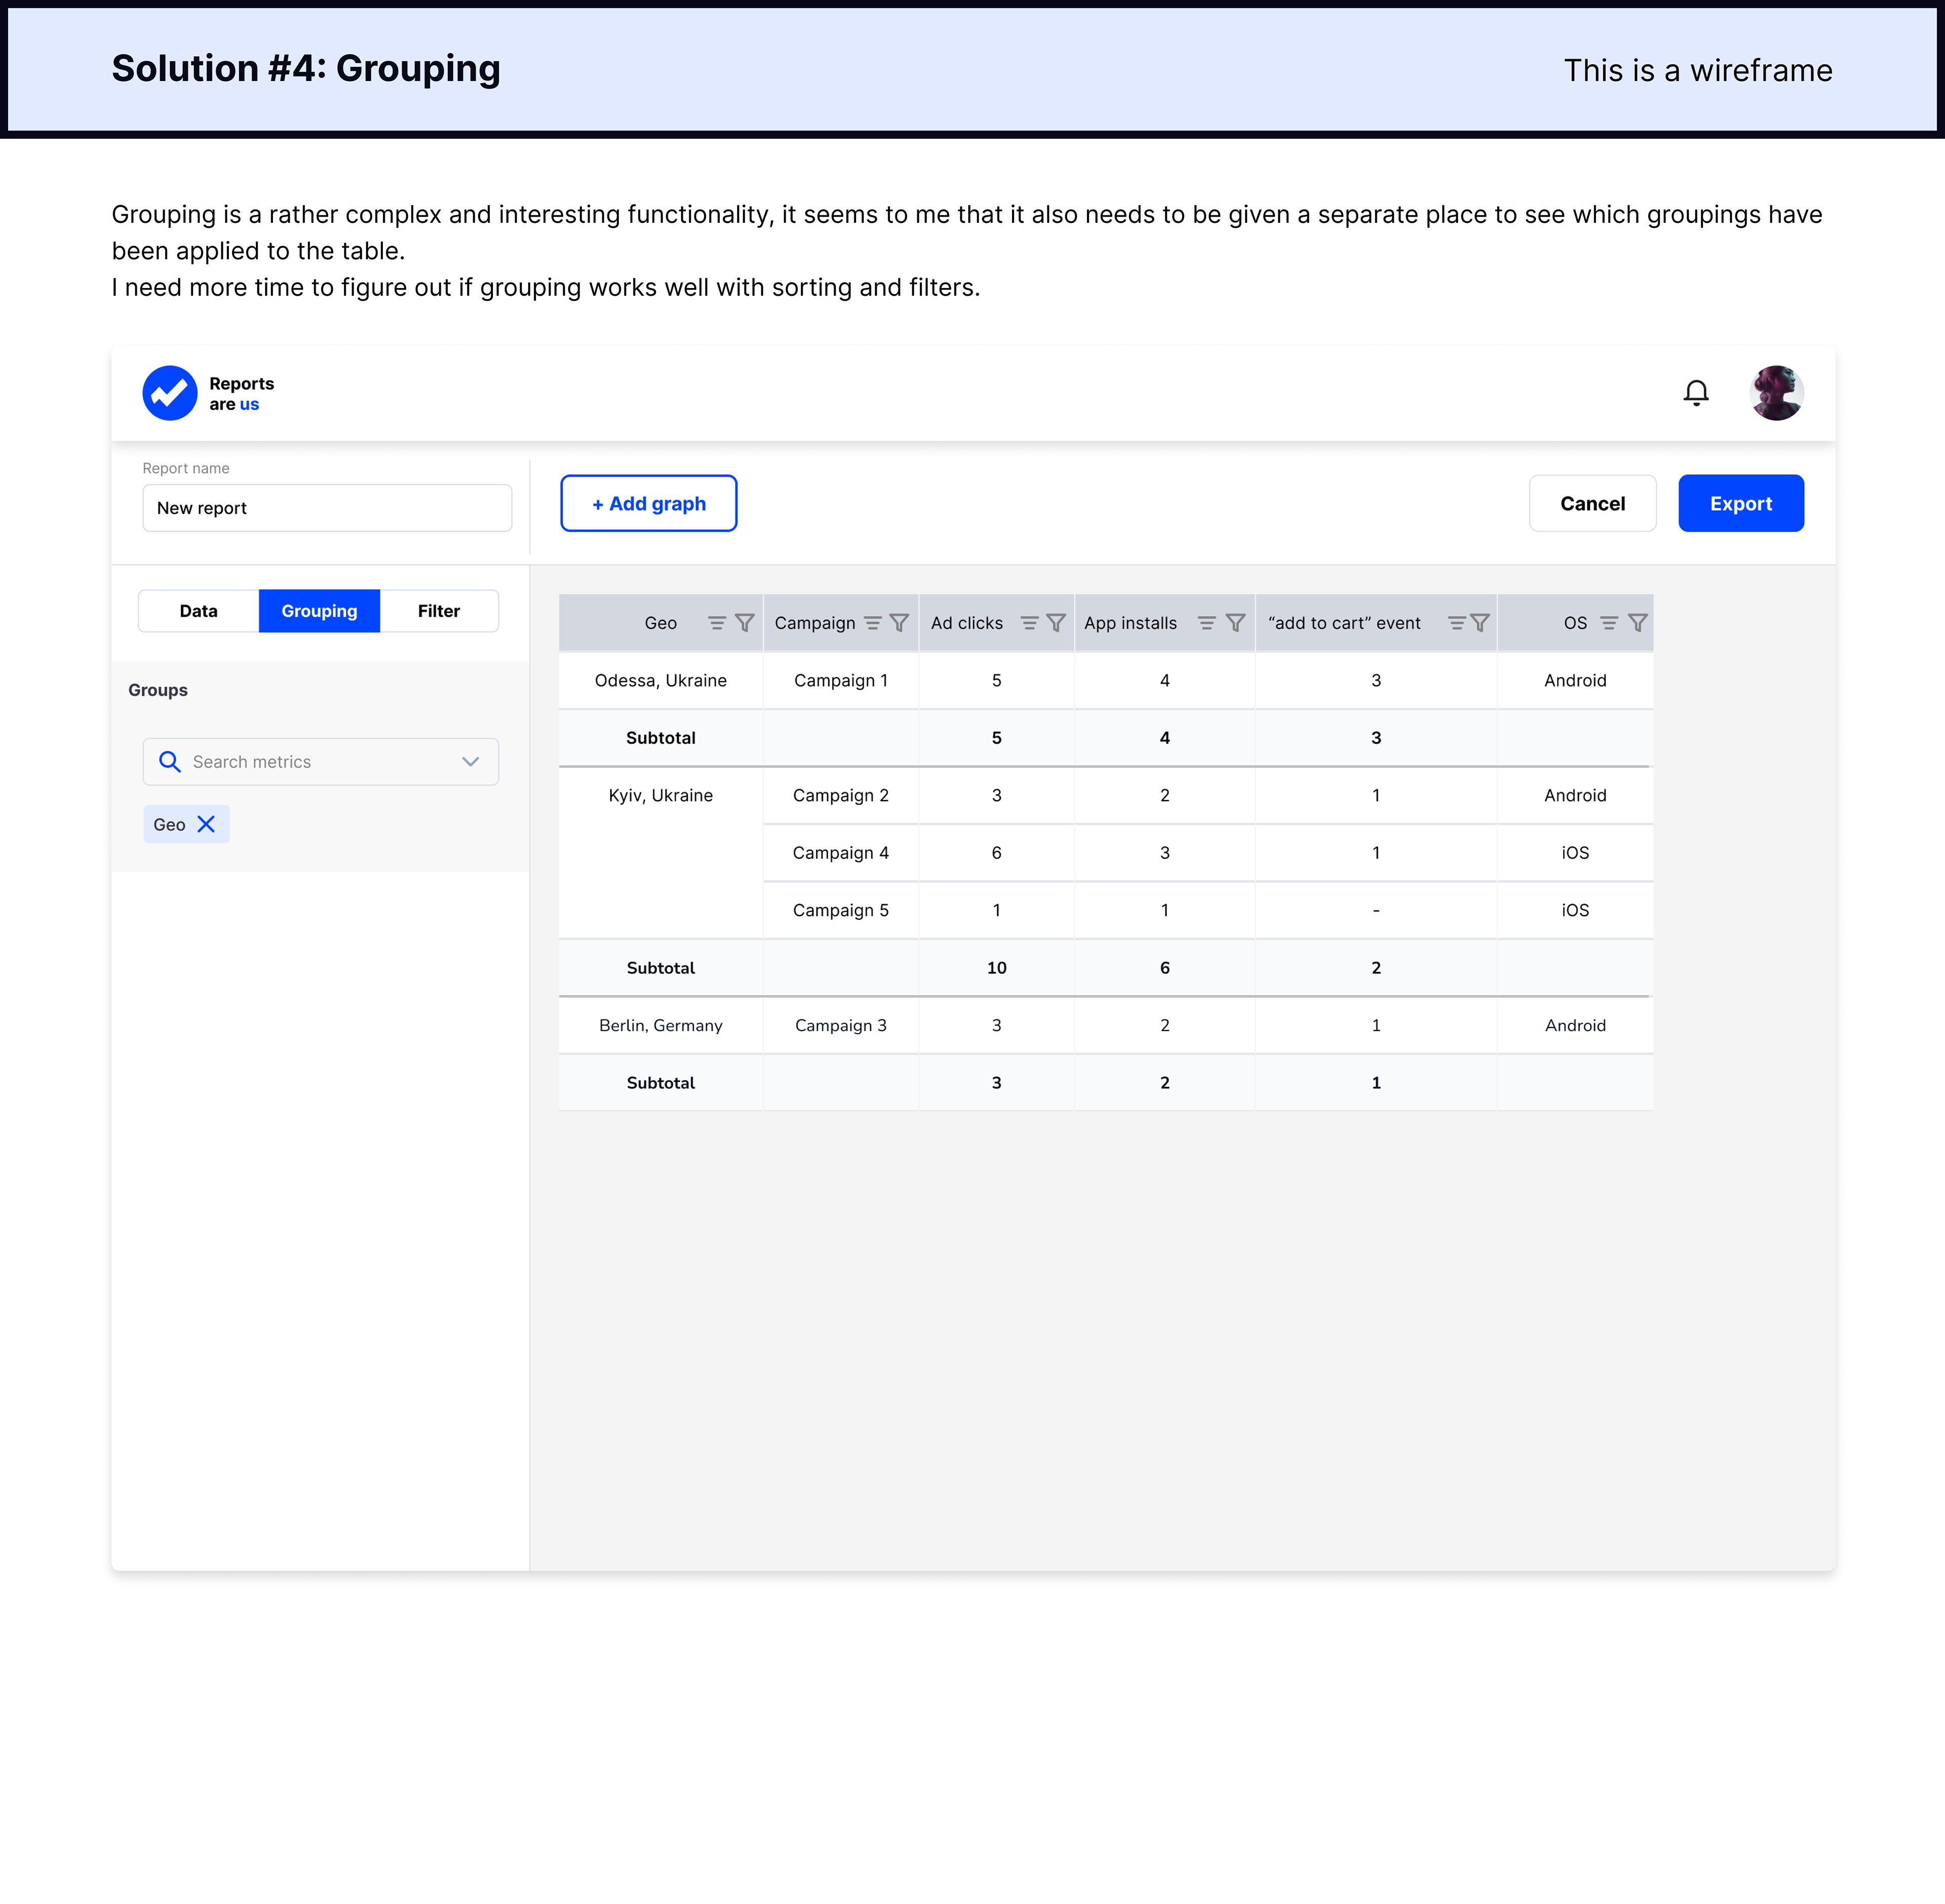
They can group data by:
- campaign;
- operating systems;
- selected time dimensions (day, month, year);
- geos.
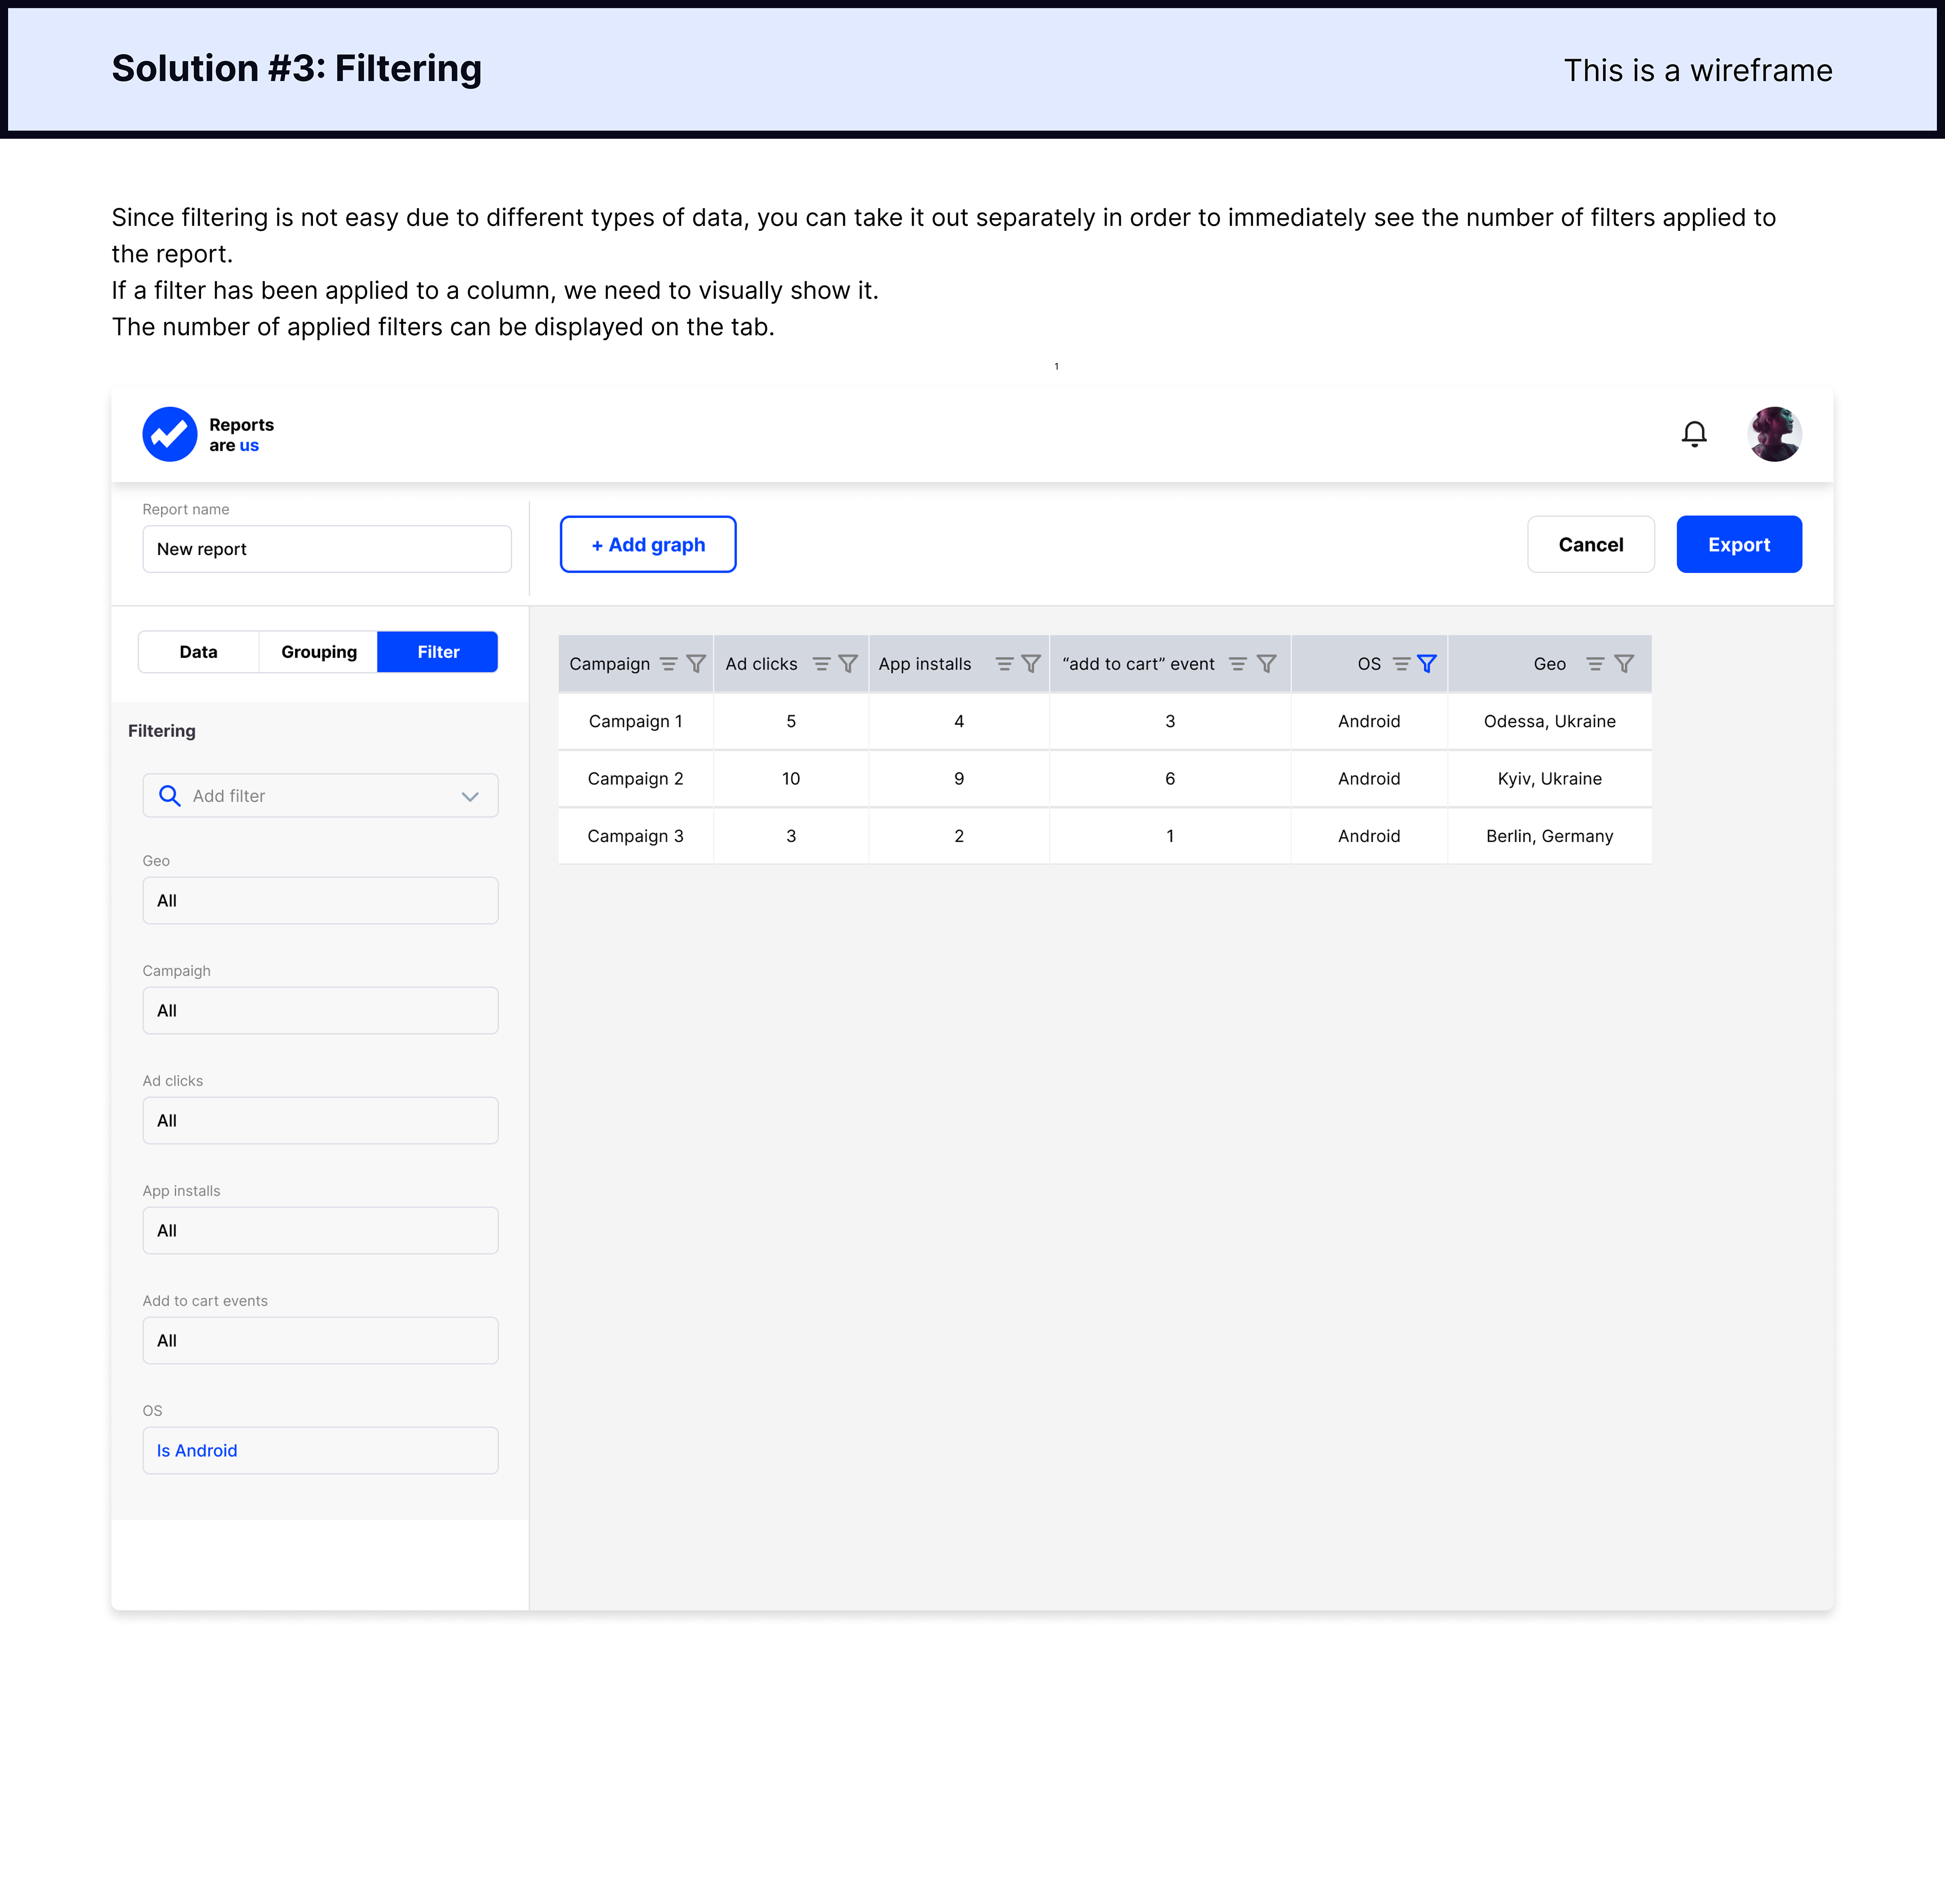
They can also filter this report by campaigns, geos and operating systems.
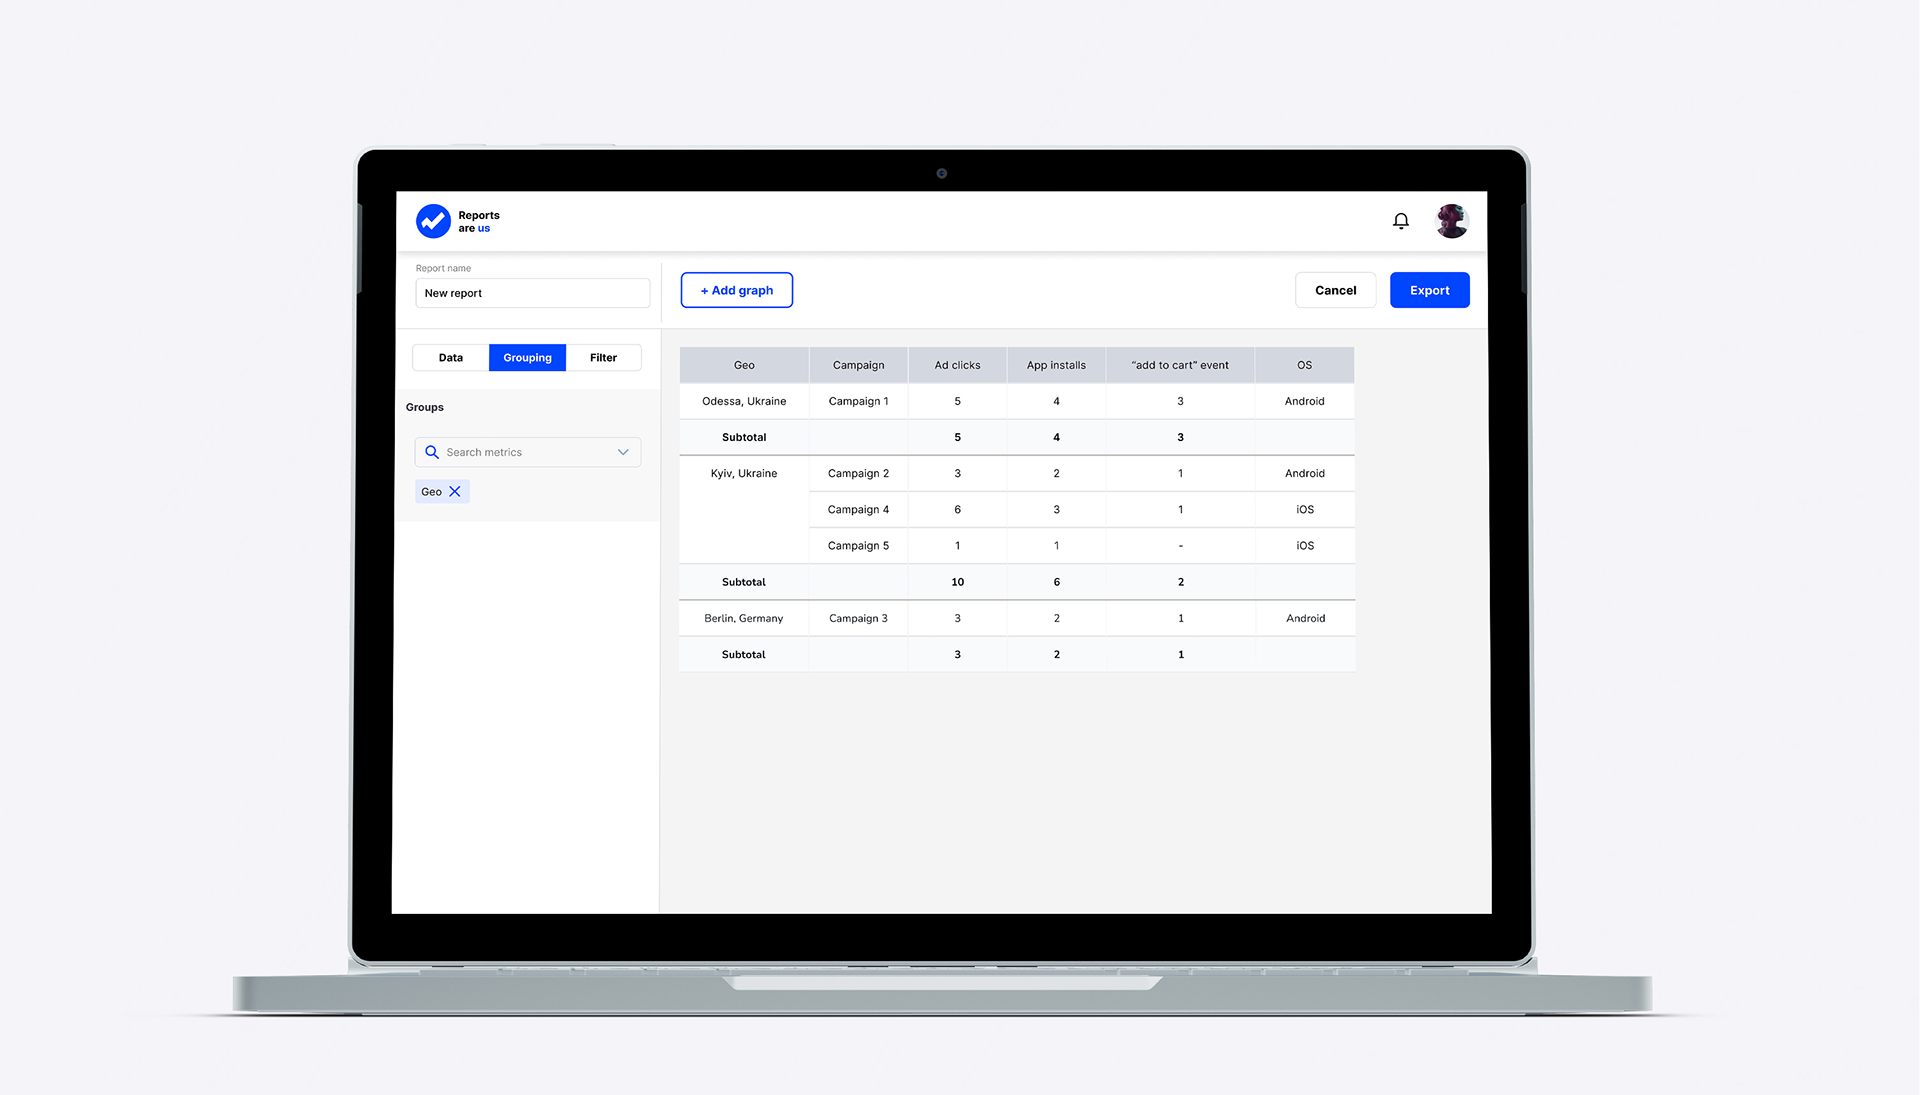
Please come with the solution which allows the user to:
- Create the report;
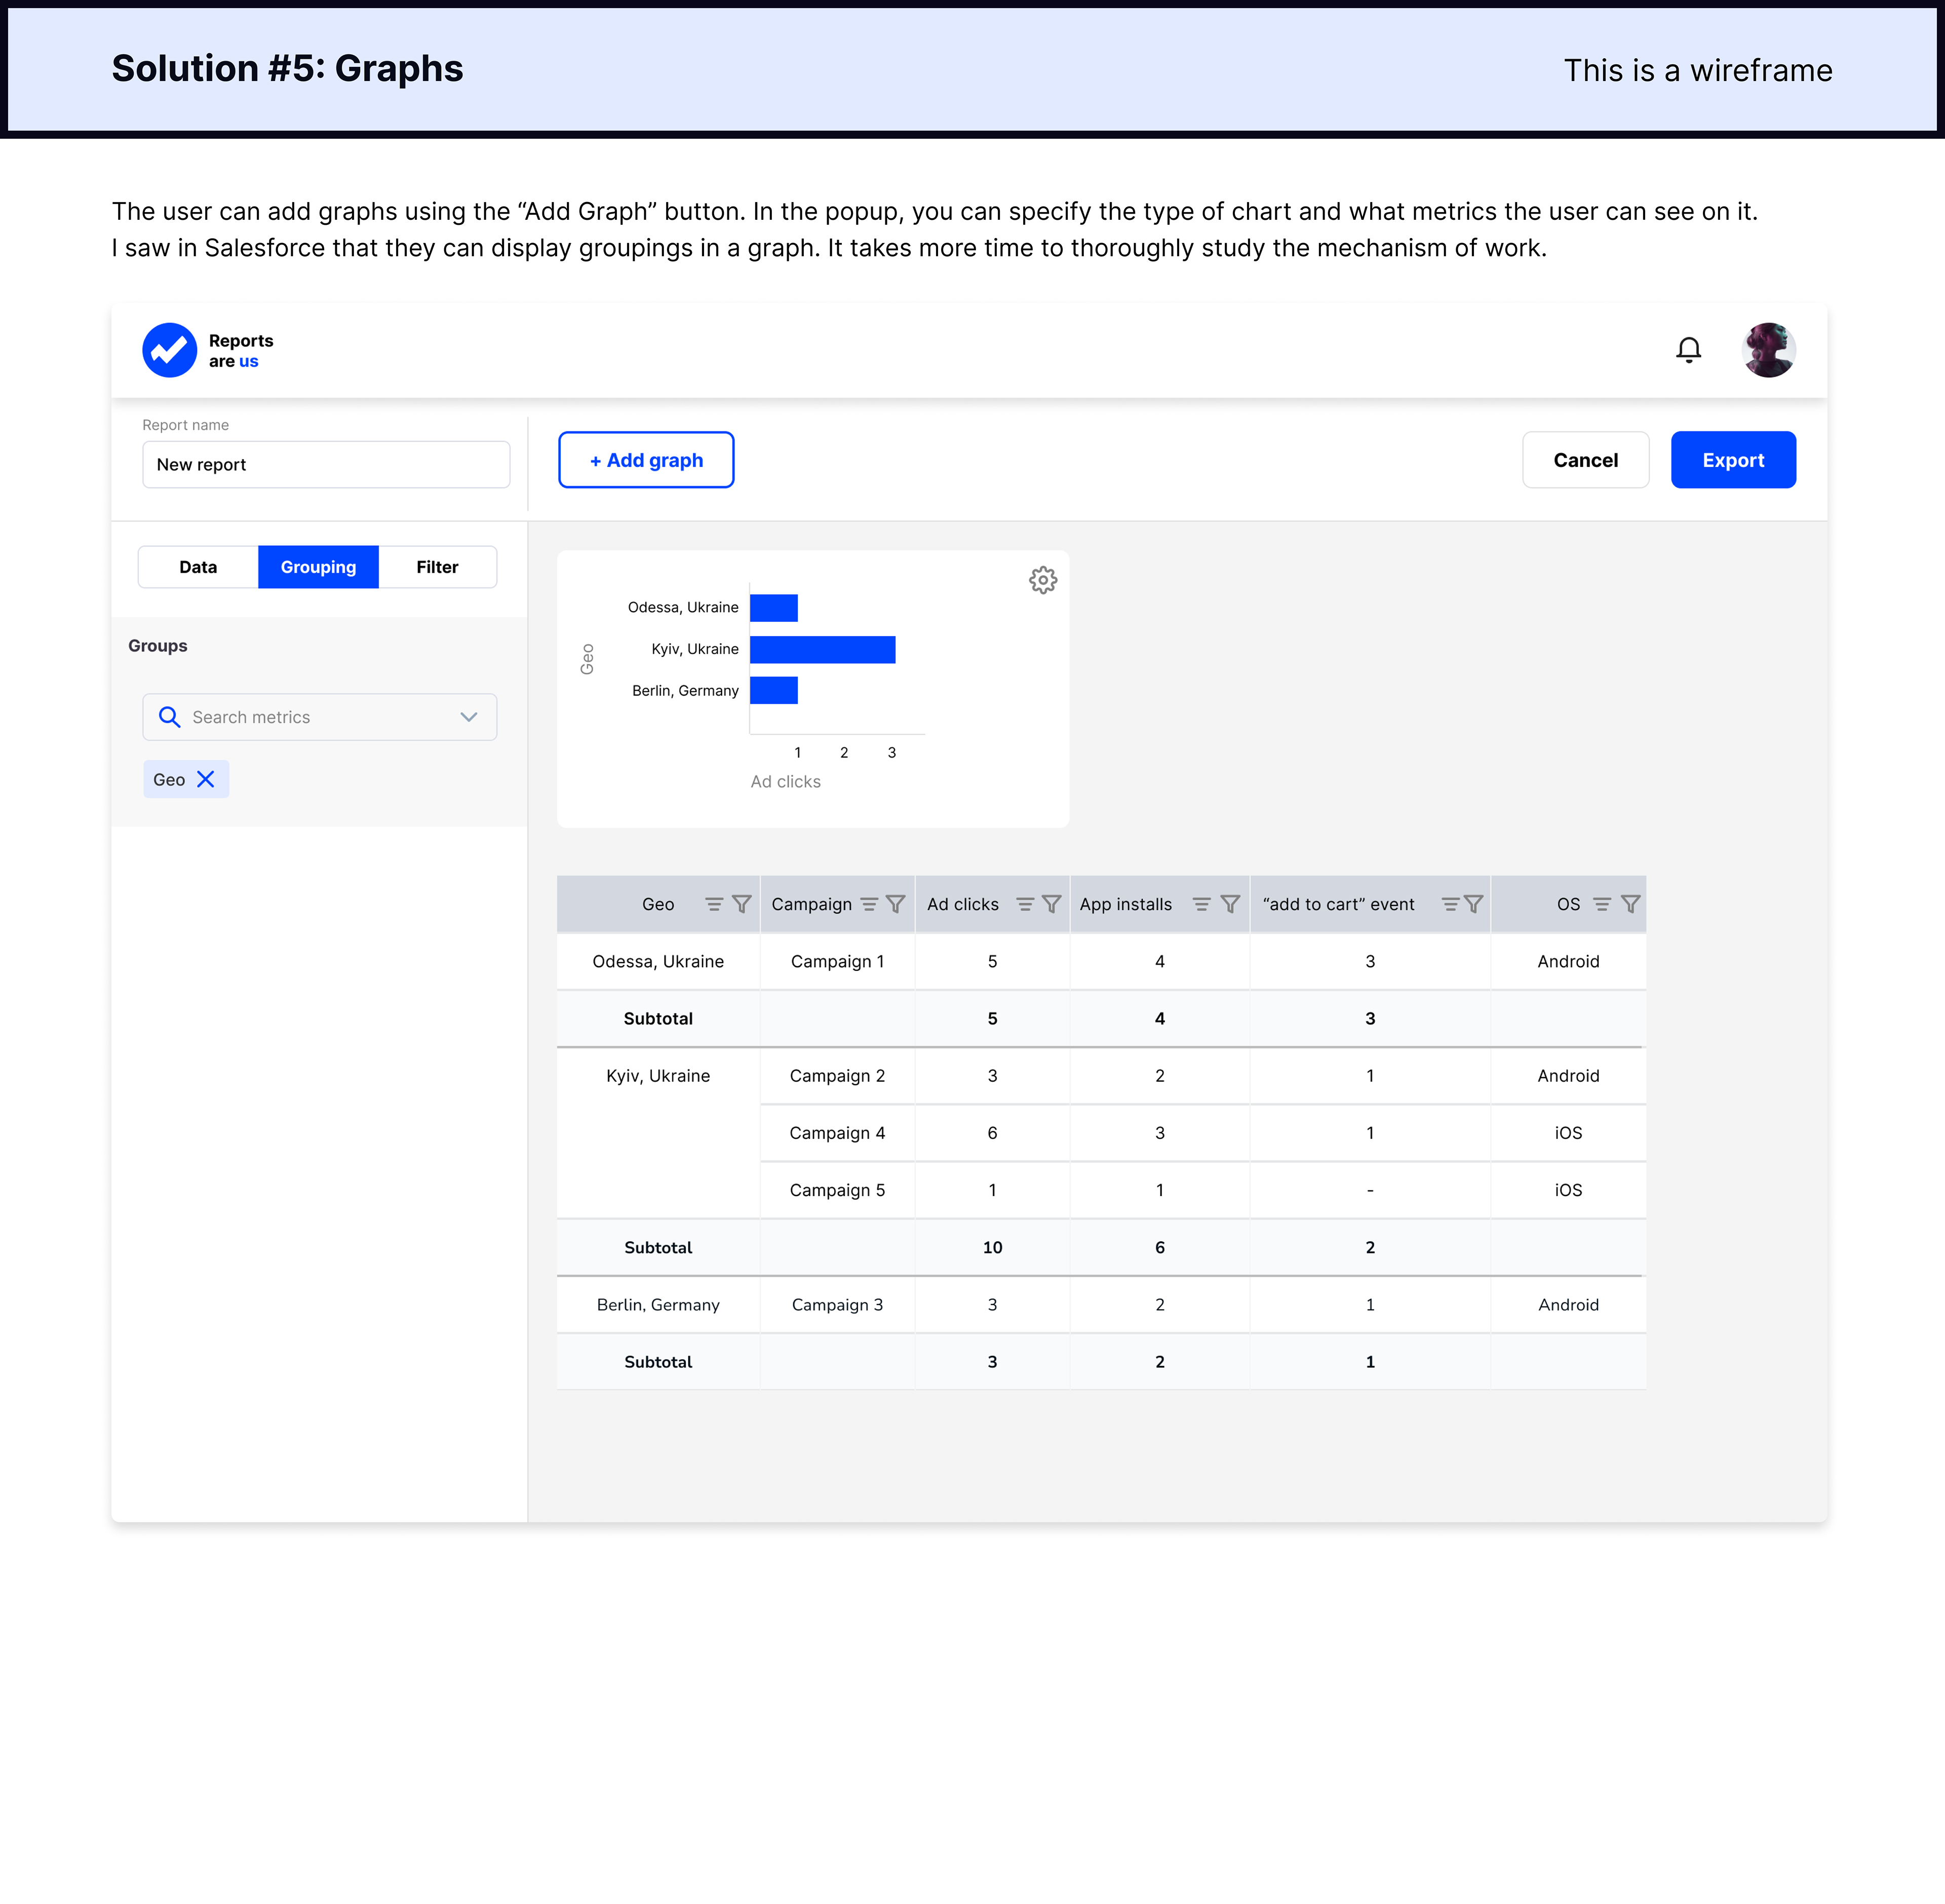
- Check the report in two ways: table view and table and graphs view.
- campaign;
- operating systems;
- selected time dimensions (day, month, year);
- geos.
They can also filter this report by campaigns, geos and operating systems.
Please come with the solution which allows the user to:
- Create the report;
- Check the report in two ways: table view and table and graphs view.
Who?
Main audience is digital marketers who run ad advertising campaigns.
Their goal is to evaluate the effectiveness of advertising campaigns and understand how it can be improved.
Another goal is to understand if the ad campaign has helped to achieve more specific goals in the application (for example, it is important not only to install the application, but also to make a purchase).
Why?
Marketers have access to a large amount of data, and they need a tool for generating reports on individual characteristics in order to see connections and patterns.
This is the problem that we are trying to solve - there is a lot of data that needs to be effectively selected for familiarization for the marketer and his colleagues.
Success criterion is a tool that allows you to generate a table and graph report from the available metrics.
This is the problem that we are trying to solve - there is a lot of data that needs to be effectively selected for familiarization for the marketer and his colleagues.
Success criterion is a tool that allows you to generate a table and graph report from the available metrics.
Context of Using
- The created advertising campaign is over, and it is necessary to assess its success;
- It is necessary to compare several advertising companies;
- Understand the difference in the success of advertising campaigns for different audiences;
- Understand how an advertising campaign can be improved;
- It is necessary to compare several advertising companies;
- Understand the difference in the success of advertising campaigns for different audiences;
- Understand how an advertising campaign can be improved;
Existing Solutions:
I analyzed the following tools:
- Google data studio;
- Salesforce;
- Adjust;
- Facebook ads;
- Google analytics.
- Google data studio;
- Salesforce;
- Adjust;
- Facebook ads;
- Google analytics.
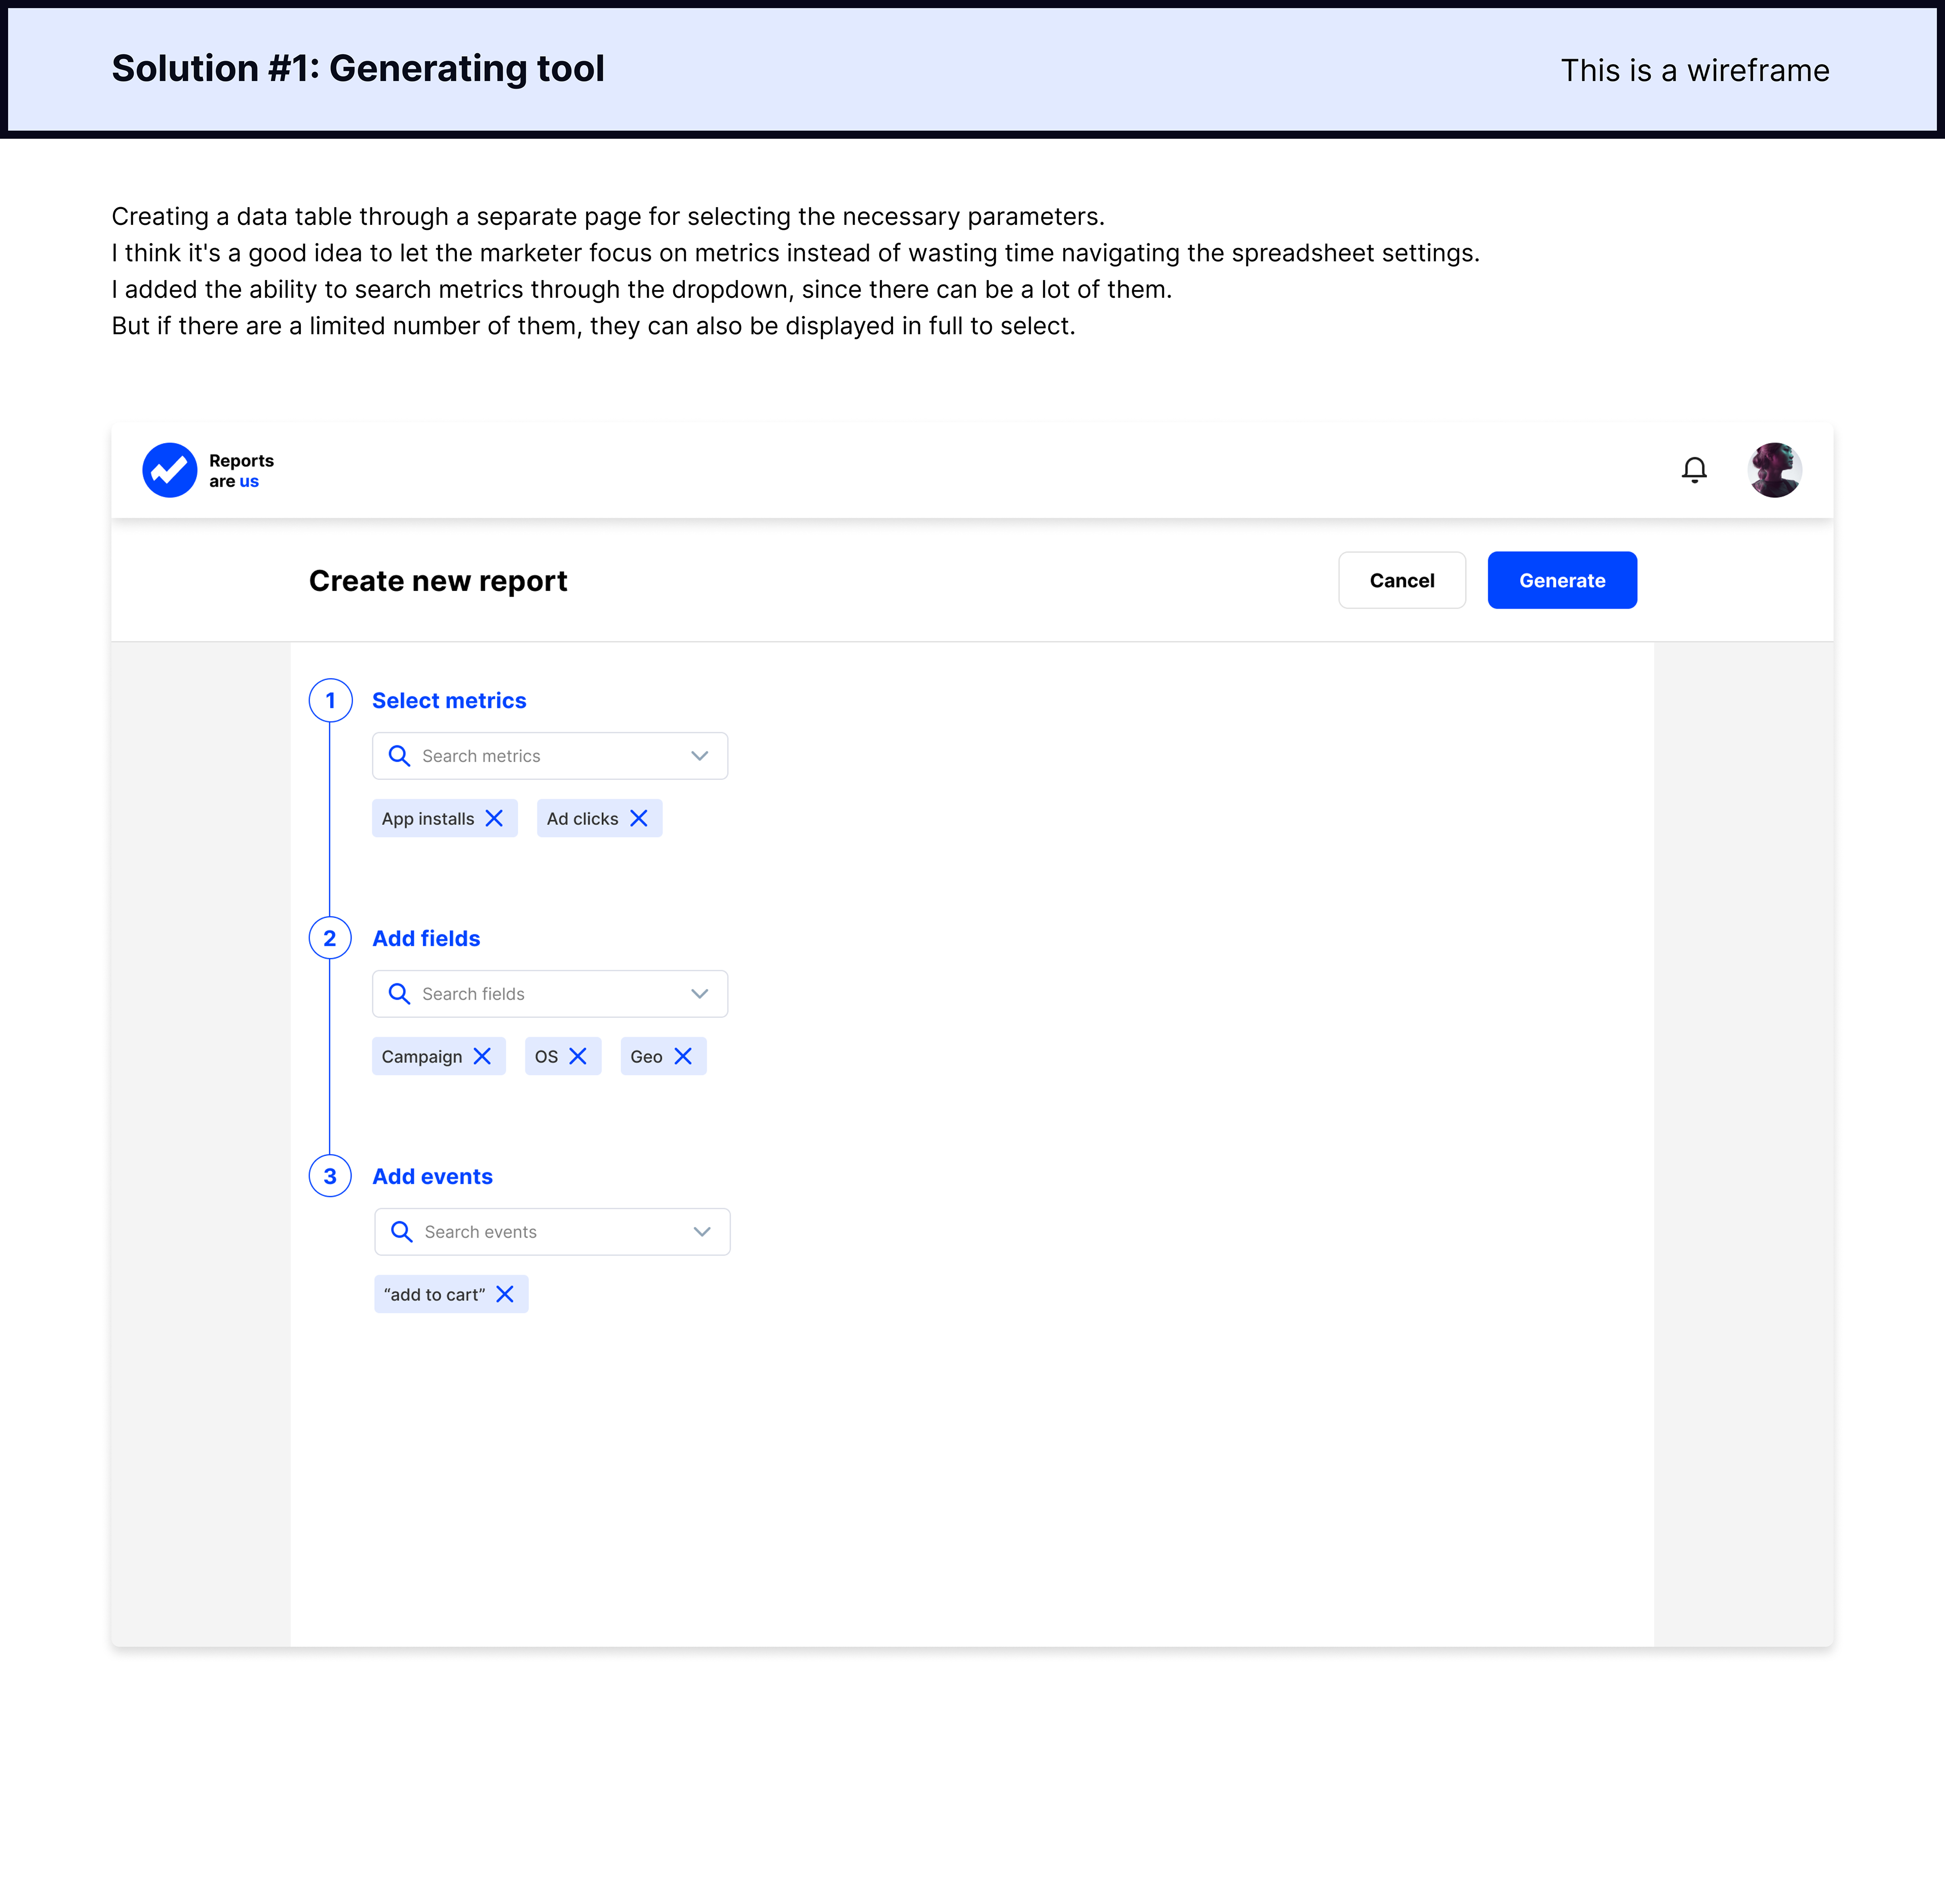
List of ideas
After reviewing the existing solutions, I noticed the pros and cons, and I want to try to make a draft solution based on these findings. Ideas so far:
- Convenient tool for generating a report from a sea of metrics;
- Ability to change report in real time;
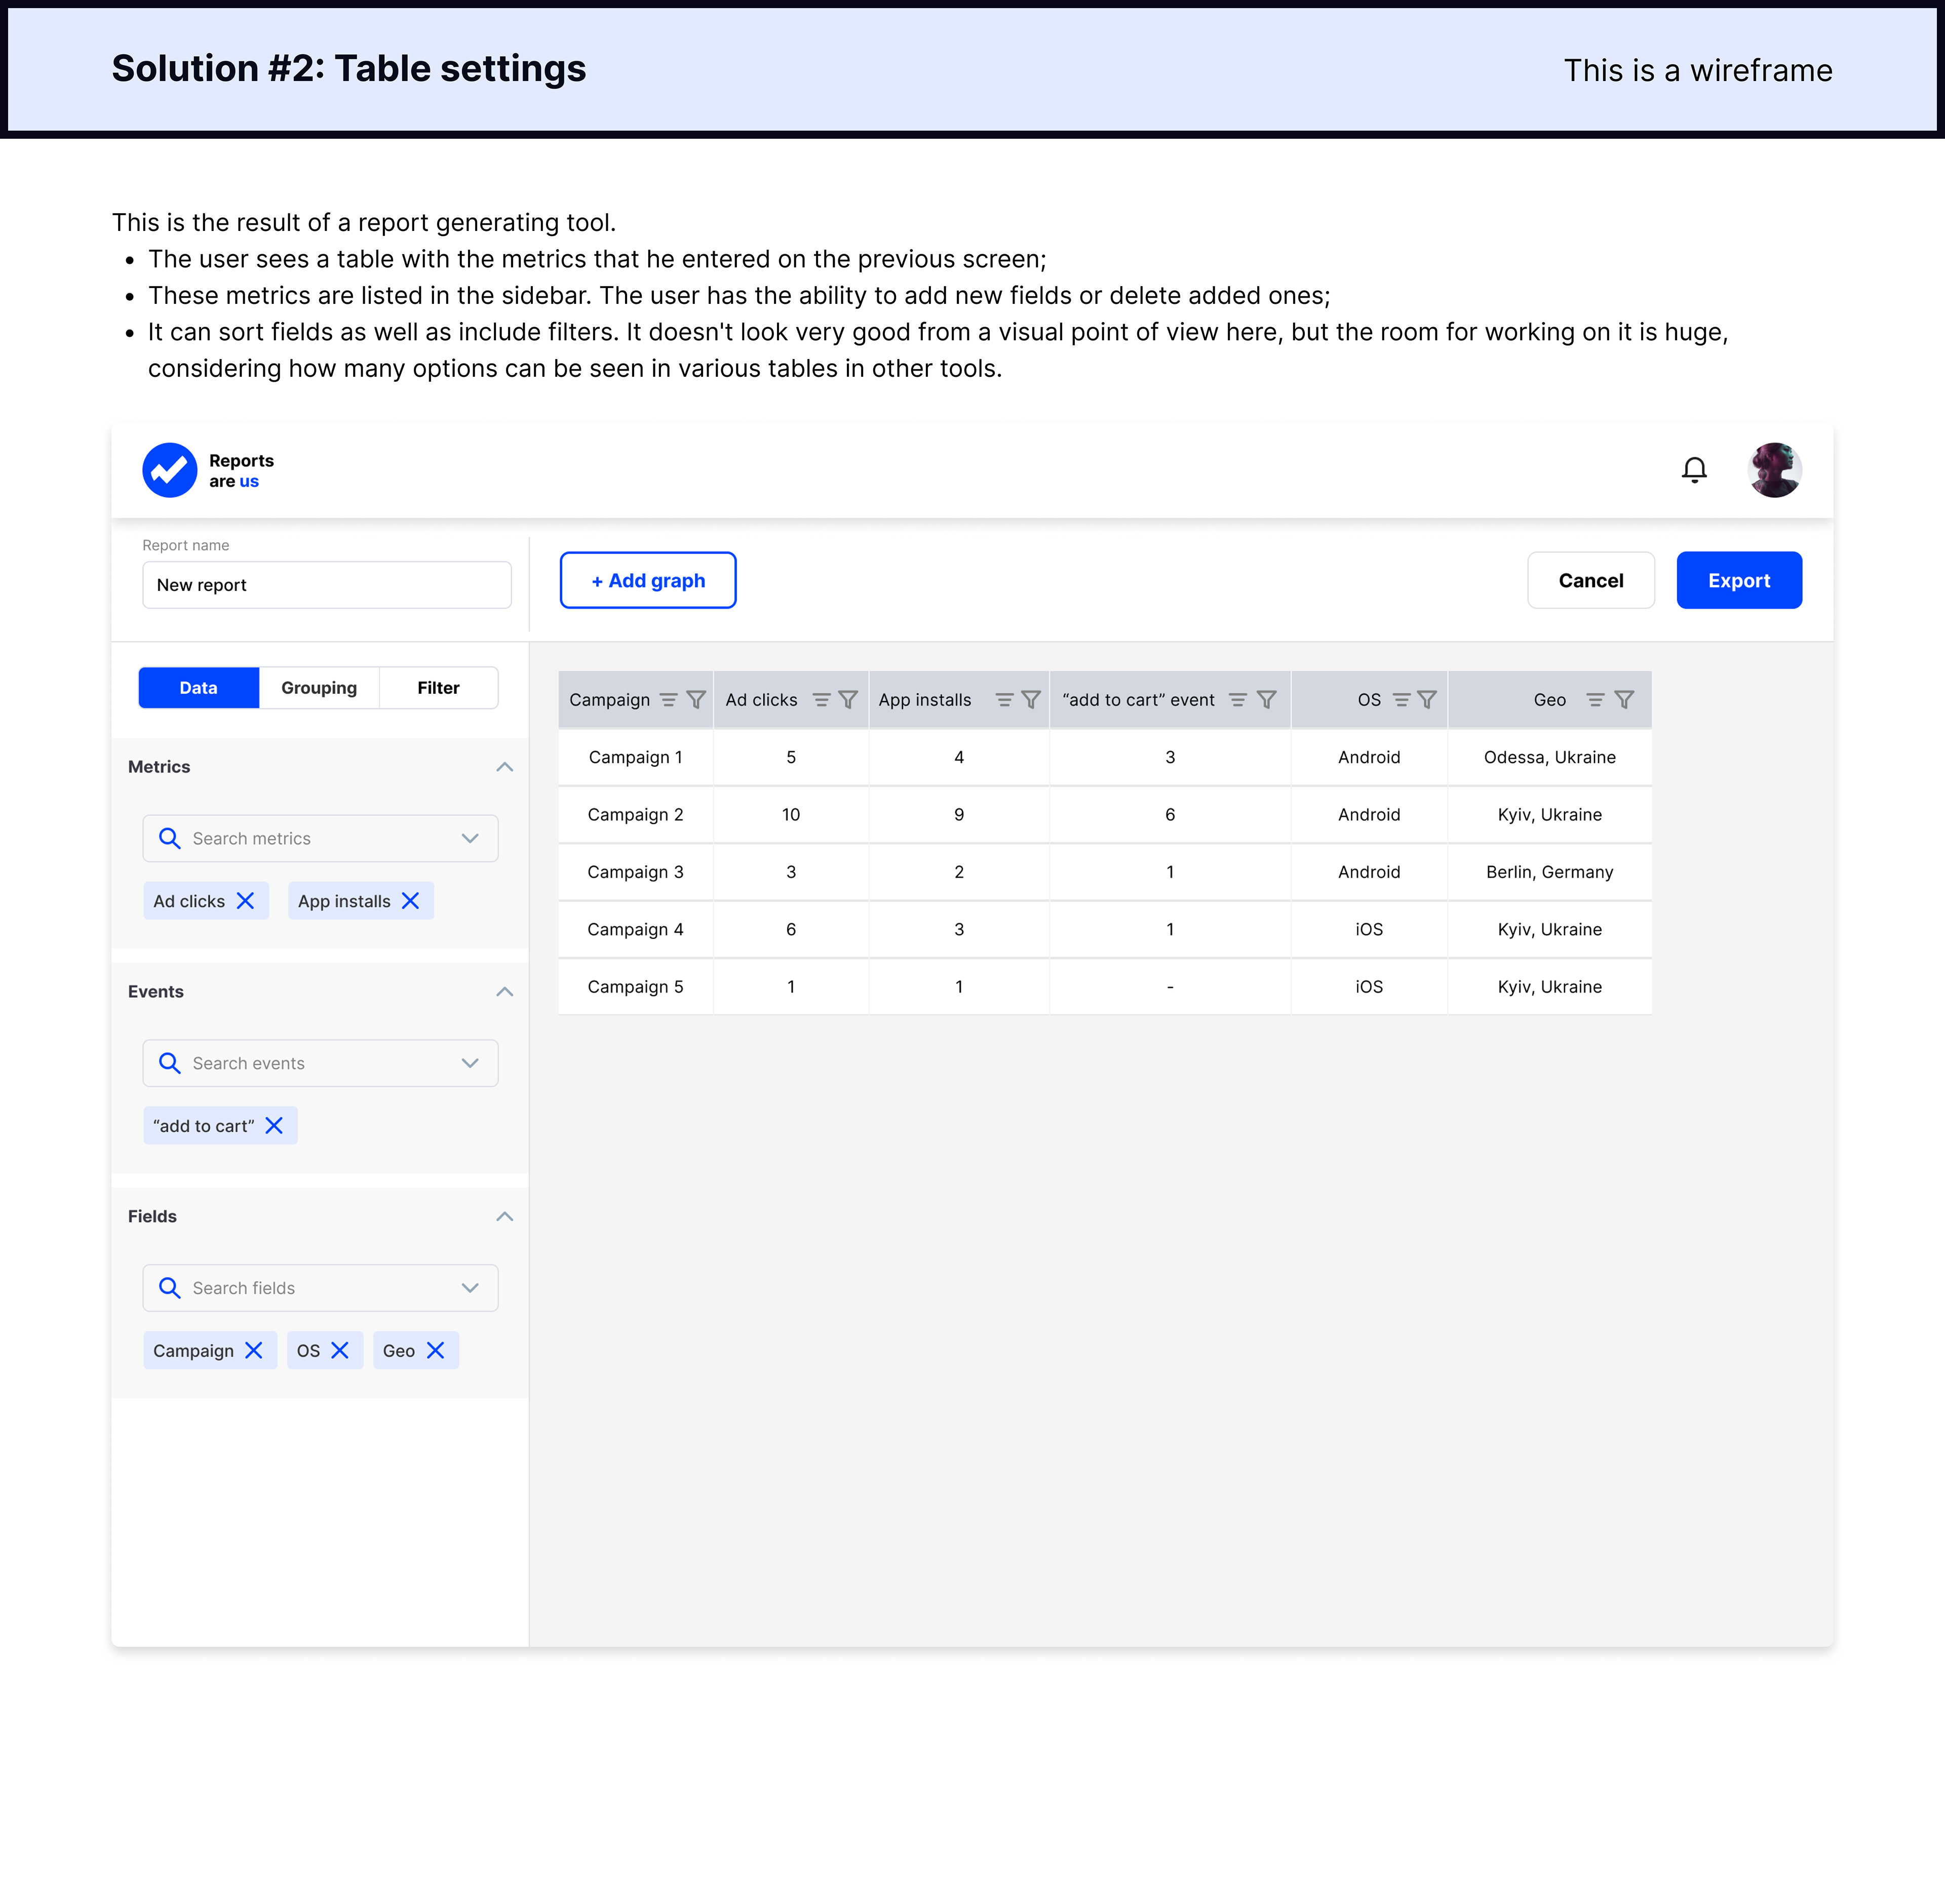
- Clearly see what settings are used for the table and ability to change it;
- Ability to add graphs using combination of metrics;
- Ability to filter any column;
- Sorting;
- Grouping the data and ability to show grouping at graphs;
- Ability to change report in real time;
- Clearly see what settings are used for the table and ability to change it;
- Ability to add graphs using combination of metrics;
- Ability to filter any column;
- Sorting;
- Grouping the data and ability to show grouping at graphs;